Scale Business Processes With Operational ETL
Automate Salesforce data integration, file data preparation, and B2B data sharing
No credit card • Full Trial for 14-Days
These companies automate their data pipelines using Integrate.io
-
Salesforce IntegrationOur bi-directional Salesforce connector rocks!LEARN MORE
-
File Data PreparationAutomate file data ingestion, cleansing, and normalization.LEARN MORE
-
REST API IngestionWe’ve yet come across an API we can’t ingest from!LEARN MORE
-
Database ReplicationPower data products with 60-second CDC replication.LEARN MORE


-
100s of Native ConnectorsWe’re not in the connectors race, sorry. We do quality, not quantity.
-
Code-heavy SolutionWe exist for users that don’t like spending their days debugging scripts.
-
Self-serve SolutionA Solution Engineer will quickly tell you if we’re a good fit. Then lean on us as much or as little as you like.
-
Trigger-based PipelinesWe don’t do trigger or event-based pipelines. We can schedule ETL pipelines for every 5 minutes and CDC pipelines for every 60-seconds.


Low-Code Data Pipelines
For Automating Manual Data Processes
The complete data pipeline platform built for driving operational efficiencies by automating manual data preparation and processes

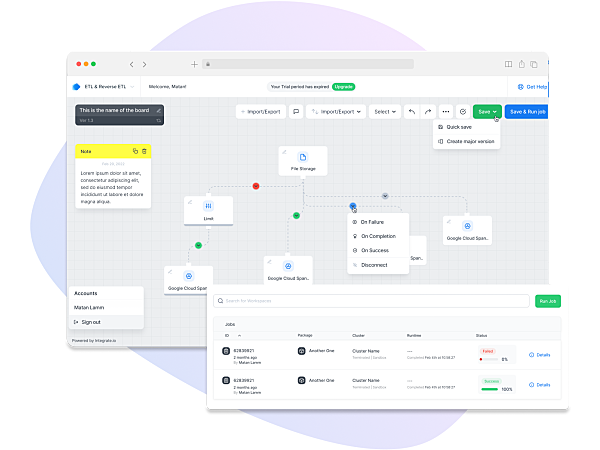
Low-Code ETL Data
Pipelines In Minutes
Pipelines In Minutes
Easily prepare & transform your data with our powerful drag-and-drop interface
Learn More

The Industry’s Fastest
Database Replication
Database Replication
60-second CDC database replication to power data products
Learn More
One Platform To Support Your Entire Data Journey
-
Automate Manual ProcessesStreamline data
preparation and
sharing in minutes -
Operationalize
Your DataGet the right data
into your most
important systems -
Power Your
Data ProductsCreate data-based
internal & external
facing applications -
Future-Proof Your
Data JourneyScale to meet any
challenge with a
complete data platform


Connect 150+
Data Sources & Destinations
Data Sources & Destinations
We specialize in building advanced bidirectional connectors
for the leading integrations.
for the leading integrations.
Get Your Data. Use Your Data.
Achieve Your Goals.
FIND YOUR CONNECTORS
Achieve Your Goals.
Truly Uncommon Customer Support
We ensure your team's success by partnering with you from day one to truly understand your needs & desired outcomes. Our only goal... is to help you overachieve on yours.
Best Customer Service Ever!
“They have been the best customer service team I have ever worked with from any outside vendor.”
- Matthew P., Analytics Manager

We’re committed to delivering the best support in the industry
See our latest support metrics
92%
Customer Satisfaction Score
2m
Average First Response
51m
Average Time to Resolution
Multiply Your Data Team Outcomes
Maximize your data team's output with all of the simple, powerful tools & connectors you’ll ever need in one low-code platform. Empower any size data team to deliver on time & under budget.
TRY IT FREE FOR 14 DAYS

What Our Customers Say...
-
![Ensure Data Quality]()
![star]()
![star]()
![star]()
![star]()
![star]() “"The Integrate.io Platform is a great ETL & Data Transformation Solution! Connecting Salesforce, Hubspot, Google Analytics, Facebook Ads, etc... has never been easier."
“"The Integrate.io Platform is a great ETL & Data Transformation Solution! Connecting Salesforce, Hubspot, Google Analytics, Facebook Ads, etc... has never been easier." -
![Ensure Data Quality]()
![star]()
![star]()
![star]()
![star]()
![star]() “Awesome ELT Tool
“Awesome ELT Tool
No code tool, easy to set up/use, nice schedules, price balance! -
![Ensure Data Quality]()
![star]()
![star]()
![star]()
![star]()
![star]() “Best Customer Service Ever!
“Best Customer Service Ever!
They have been the best customer service team I have ever worked with from an outside vendor. Always very responsive, and go above and beyond to resolve issues or instruct on the product.


Ultimate Data Security
Simplified Regulatory Compliance
Simplified Regulatory Compliance
The security of your data is always our #1 priority. Implement your data strategies while adhering to stringent data security laws and best practices with support from our professional CISSP & Cybersecurity-certified team.
The Unified Stack
for Modern Data Teams
Connect with us about using our no-code pipeline platform for your entire data journey
